Email: connect@moleculeinsights.com | Phone: +91 - 9712939332
Forecasting

Modelling
Dynamic Excel based forecast models
-
Customized models as per Business Need
-
User-friendly interface
-
Multiple Scenario Capabilities within same model
-
Dedicated sections for applying events/assumptions (e.g., New launch, Price Events etc.)
-
Integrated dashboard to view forecast outputs

Epi based and Bottom-Up Forecast
Top-Down Approach
Epidemiology Forecast approach. Forecast assumptions like Patient share (new/total), Persistency curve leveraged to estimate patients on individual drug.
Bottom-Up Approach
-
Volume or total Rx leveraged to estimate market size
-
Baseline trending to project existing market in the forecast period
-
Application of market events like new product share, etc. to estimate evented market forecast
Hybrid Approach
Reconciliation of Patient numbers from Top-down and Bottom-up approaches to provide robust market size estimates.

Data Analysis
Market Size estimations
-
Epidemiology research for specific disease
-
Prevalence rate, diagnosis rate and treatment rate
-
Patientwill funnel wherein required cuts be applied to arrive at target patient pool
-
Deriving market definition based on ATC2/ATC3/ATC4, Diagnosis codes, distinct list of products to extract market data for specific indication from audit databases like: Symphony, Iqvia etc.
New Launch Assumptions
Leveraging Secondary Research and/or PMR (Qualitative/Quantitative) to estimate:
-
Peak market share
-
Uptakeproduct curve
-
Time to peak
-
Market Access
Market/Pricing Events
-
Pipeline analysis to identify competitor launches
-
Loss of Exclusivity (generic entrants)
-
Sales Force Reach
-
Regulatory events
-
Price cuts, reimbursements events

Virtual Assistant
Welcome to our consulting services, where we offer experienced consultants ready to work remotely for flexible time periods ranging from one week to one year. Our service packs are perfect for supporting peak workloads, covering maternity leaves, or managing short-term projects without the need for long-term commitments. Enjoy transparent pricing with hourly rates and rest assured with our guaranteed data confidentiality. Let us help you meet your business needs efficiently and effectively.
Data Analytics

Dashboard/ Reporting
-
Excel based dashboards to generate user-friendly visualizations/output
-
VBA-based dashboards to create automated PowerPoint decks
-
Customizable matrix like growth rates/CAGR/aggregations as per business requirement

Analogue Analysis
-
Leveraging pharma audit databases like: symphony, Iqvia MIDAS, Therapy area expertise to identify suitable analogues through robust analogue selection funnel
-
Performing analysis on selected analogues to generate insights/assumptions as per business requirements e.g., peak share, time to peak, LOE erosion, uptake curve shape, price evolution etc.
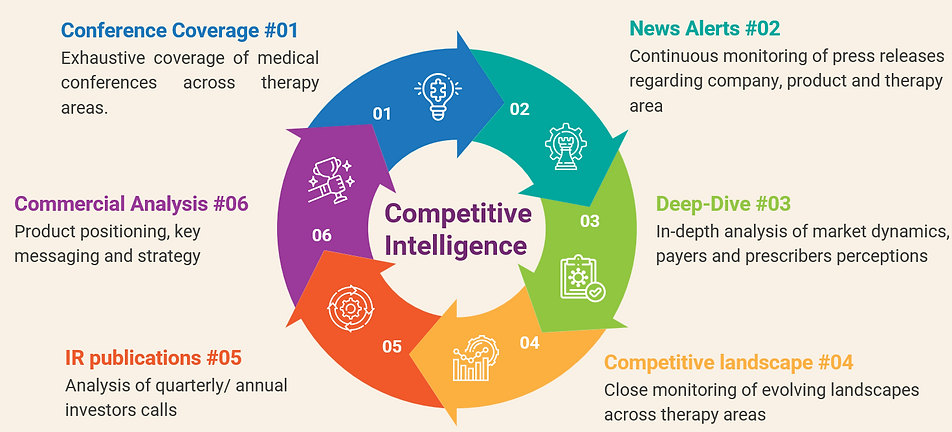
Competitive Intelligence